This week in trends · Jul 18–24, 2026 · 6 min read
What's trending this week — the measured top, Jul 18–24
The measured top of the week from our live radar: what actually gained speed between Jul 18 and Jul 24, on which platforms, with every number carrying its unit and measurement date.
Published Jul 24, 2026 · by the Lolik team, from our own radar data
Key takeaways
- Agent tooling is the week's real story — three of the five confirmed breakouts (Agent-Reach, firecrawl, browser-use) are infrastructure for AI agents.
- Durability beat raw size: the top spot goes to 402 stars/day sustained for 20 days, not to the 51K views/day spike that is only 2 days old.
- 338 new signals entered tracking this week; only 44 of 898 earned the breakout label — most of what looks hot never confirms.
- All figures measured Jul 24, 2026 on our own radar — units and tracking windows stated inline.
898
signals live-tracked this week
338
new signals first seen this week
44
in breakout phase
7
niches covered
Where the 898 live signals stand
Most of what spikes never confirms — only 44 of 898 signals held the breakout label this week. Counts measured Jul 24, 2026.
The confirmed top 5 — signals with sustained, observed velocity
These five cleared our confirmation bar: velocity sustained across enough tracked days to be marked observed, not just spiking. Ordered by overall score (velocity × acceleration × durability), not by raw numbers alone. The bar under each velocity is scaled within its own unit group — stars/day and views/day are never compared on one scale.
Agent-Reach
BreakoutBusiness / AI toolingHeyGen (AI video)
BreakoutAI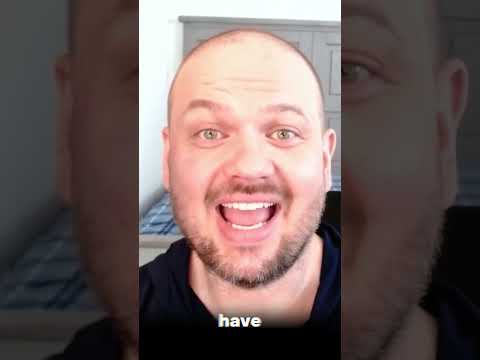
Vibe-Trading
BreakoutFinancefirecrawl
BreakoutAIbrowser-use
BreakoutAIThe early watchlist — flagged, still confirming
Everything below is under a week old on the radar. This is the phase where the timing edge actually lives — and also the phase with the most false starts, which is why we label it honestly instead of shouting "breakout" on day two. How to read this phase: our guide to spotting trends early.
"The WORST Part About Being Rich"
WatchFinance
"Why Your Coaching Business Has a Churn Problem"
WatchBusiness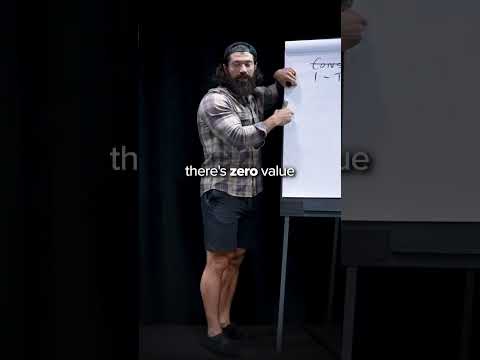
"Gear + Dirty Bulking Is Insane"
WatchHealth
What we'd do with this, practically
If you make content for the AI/developer audience, the agent-tooling cluster is a confirmed, durable wave — comparison and tutorial angles still have room while the topics climb. The finance-psychology and coaching-churn signals suit creators in those niches who can publish within days, not weeks: watch-phase topics reward speed and punish delay.
For the full pipeline from a signal like these to an actual brief — finding topics before they peak and monetizing them realistically.
Measured, in public
In our own backtest, early-phase alerts kept growing over the next 5 days in 47.7% of cases vs a 2.2% baseline across every tracked signal-day — 21.4× more likely to keep growing than a random tracked trend (n=65 from 30 unique signals, Aug 6 – 12, 2026, a window with zero overlap with anything we published before). That sample is small — the conservative read is the bottom of the 95% interval, still 9×. Across the wider Jul 2 – Aug 12, 2026 window (n=374) the same measurement gives 11.1×.
Point-in-time figures, re-measured weekly — full methodology and every call, wins and misses, in the public log.
Common questions
How is “trending” measured here?
Every signal is tracked daily on its native unit — stars/day for GitHub repos, views/day for YouTube — and ranked by a score that weighs velocity, acceleration and durability. All figures in this post were measured on Jul 24, 2026; they are point-in-time snapshots, not live numbers.
What do Breakout and Watch mean?
Watch = elevated velocity, still confirming (typically under a week of data). Breakout = velocity sustained and accelerating across enough tracked days to be confirmed. Fresh spikes stay in Watch no matter how big the raw number is — a 2-day spike can die as fast as it appeared.
Why didn't the biggest number win the top spot?
Because raw size and confidence are different things. A 51K views/day spike with 2 days of history is less reliable than 402 stars/day sustained for 20 days. The ranked list only includes signals our system marks as observed; everything younger sits in the watchlist.
Can I see these signals live instead of weekly?
Yes — the radar updates daily and the free tools run on the same data, no signup. The weekly post is the measured summary; the product is the live feed. Timing edge is a possibility, not a guarantee — outcomes depend on your execution.
Want next week's list while it's still forming?
The free tools run on the same live data as the paid radar — no signup, no card. Start there; upgrade only if the timing edge earns it.